Choose a period
In the KPI dashboard, select one of the available periods: the past 3, 6, 12 or 24 months. The heatmap shows the geographic density of reports received during that period.
 powerlocal.
For municipal planning and administration
See where reports cluster across your municipality and follow how the overall totals change from month to month.
See the workflow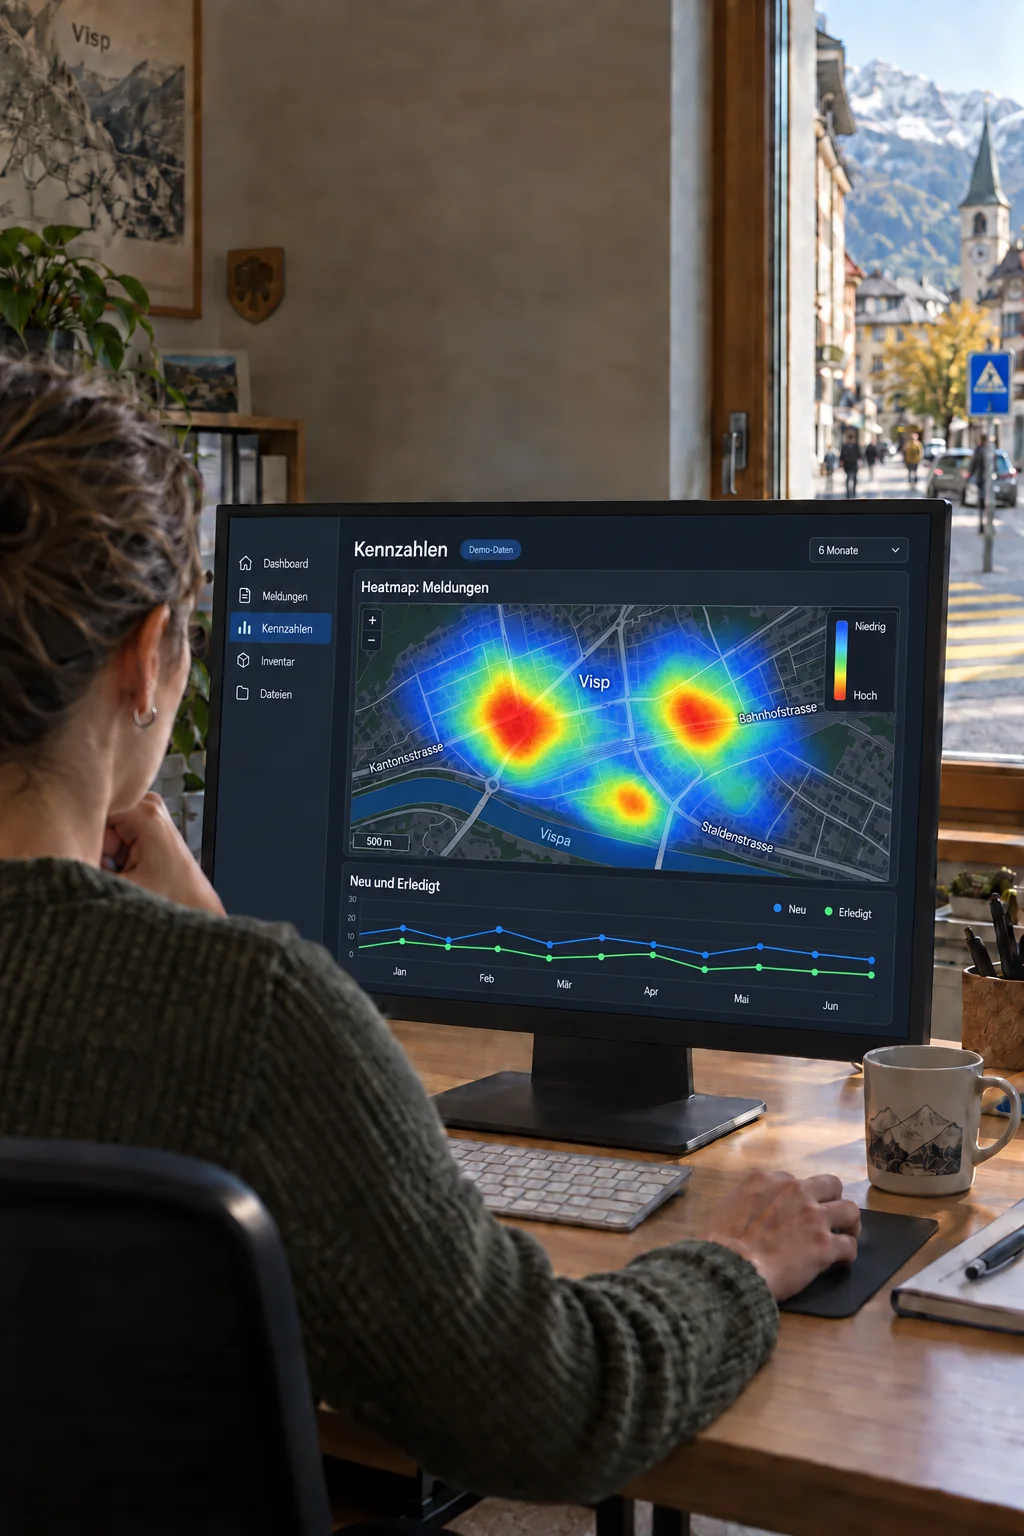
For everyday work on site
The heatmap shows where reports with a location were concentrated during the selected period. Your administration can use these patterns to decide which places to investigate. The monthly chart compares new and resolved reports across the whole municipality, bringing geographic concentrations and the overall trend into view.
In the KPI dashboard, select one of the available periods: the past 3, 6, 12 or 24 months. The heatmap shows the geographic density of reports received during that period.
Look more closely at areas with many reports. Review the individual reports and the situation on site before planning action. Few reports do not necessarily mean that an area has no problems.
The line chart shows how many reports were received and resolved each month. It describes the trend across the whole municipality and helps with planning further work.
Any more questions?
Yes. The KPI dashboard is part of the platform. It shows new and resolved reports, response and resolution times, and breakdowns by category or department. What the figures can tell you depends on the data recorded; missing timestamps are identified.
Open in the FAQYes. Roles and individual permissions can be managed, while departments reflect who is responsible for the work. You can decide who may handle reports, manage inventory or view particular folders.
Open in the FAQAfter submission, they receive a confirmation with a private link. They can use it to follow progress or withdraw their report. Email notifications can also be used when the relevant contact details have been provided.
Open in the FAQMade for these places, too
The next step
Your field, scale and suitable plan: the key facts for your project. A live video demo is available if you would like one.